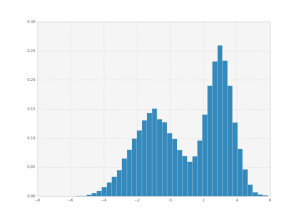
Let’s say you have some data which follows a certain probability distribution. You can create a histogram and visualize the probability distribution, but now you want to sample from it. How do you go about doing this with python?
The short answer:
import numpy as np
import scipy.interpolate as interpolate

def inverse_transform_sampling(data, n_bins=40, n_samples=1000):
    hist, bin_edges = np.histogram(data, bins=n_bins, density=True)
    cum_values = np.zeros(bin_edges.shape)
    cum_values[1:] = np.cumsum(hist*np.diff(bin_edges))
    inv_cdf = interpolate.interp1d(cum_values, bin_edges)
    r = np.random.rand(n_samples)
    return inv_cdf(r)
The long answer:
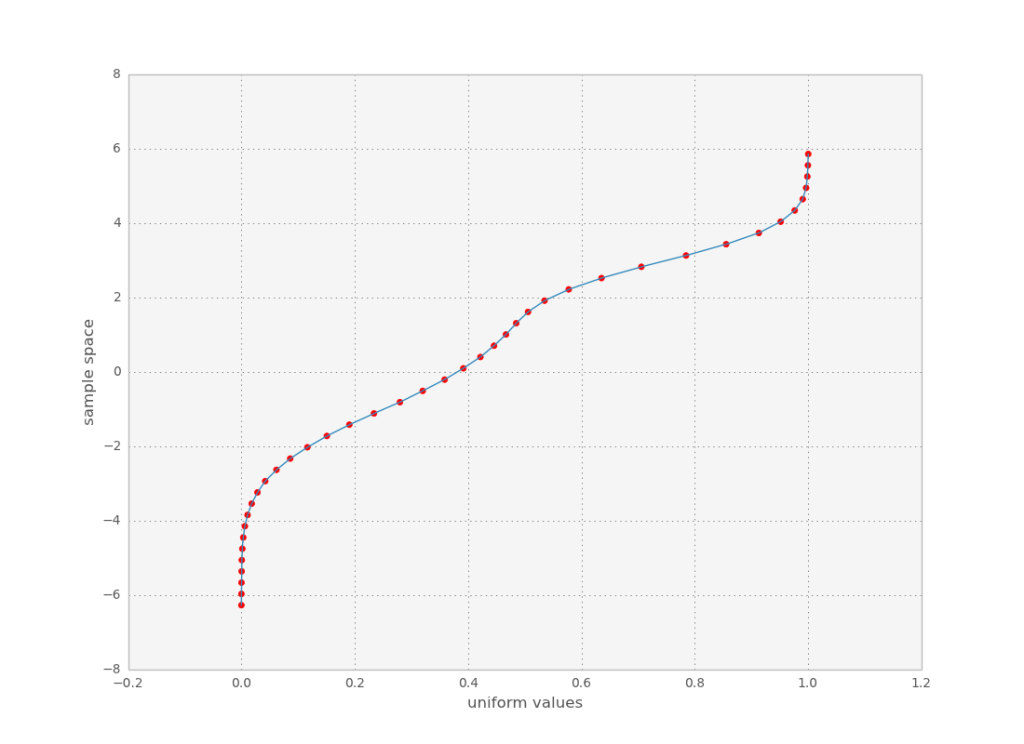
You do inverse transform sampling, which is just a method to rescale a uniform random variable to have the probability distribution we want. The idea is that the cumulative distribution function for the histogram you have maps the random variable’s space of possible values to the region [0,1]. If you invert it, you can sample uniform random numbers and transform them to your target distribution!
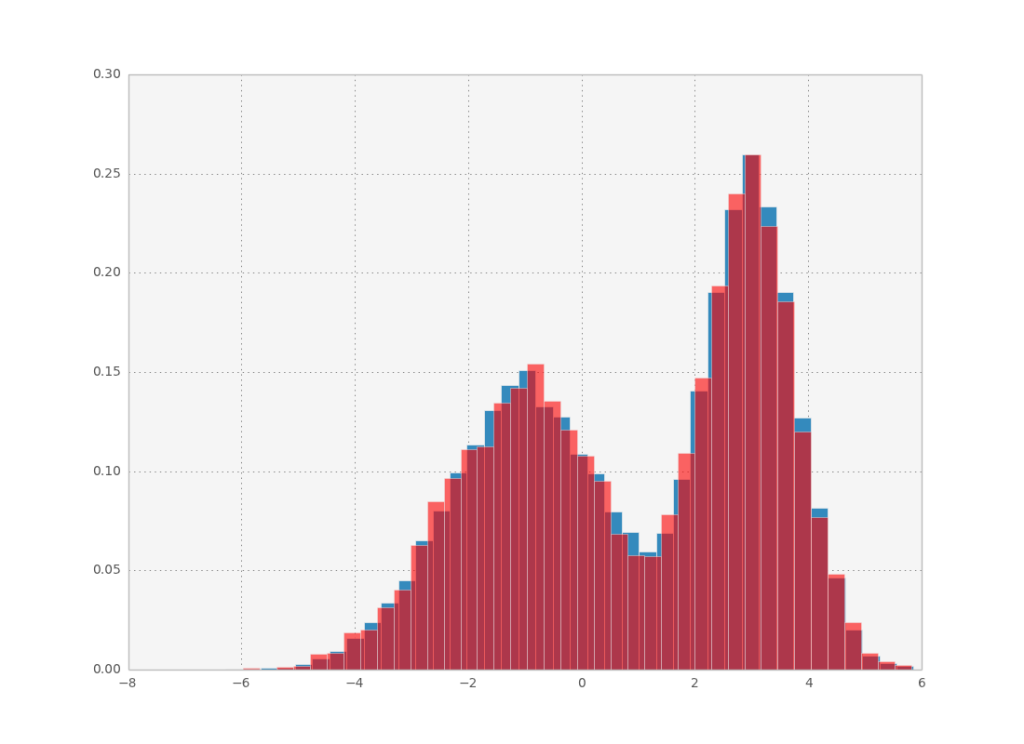
To implement this, we calculate the CDF for each bin in the histogram (red points above) and interpolate it using scipy’s interpolate functions. Then we just need to sample uniform random points and pass them through the inverse CDF! Here is how it looks:


